Which Car Brands Make the Best Vehicles?
We ranked 34 brands based on the Overall Scores of their models, which include road tests, reliability, satisfaction, and safety
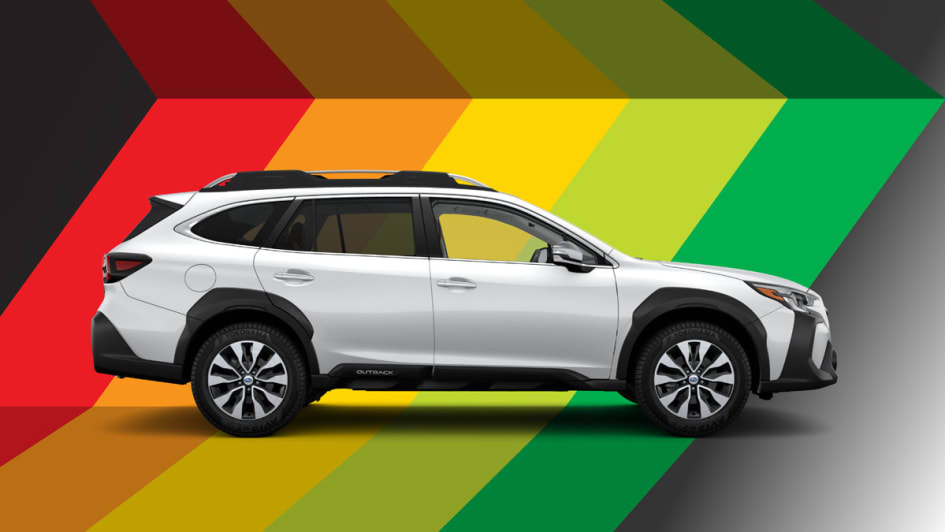
Our annual rankings of 34 automakers can steer you in the right direction when making a new-car purchase. These rankings are based on the average Overall Score, a combination of our road-test scores, predicted reliability and owner satisfaction data, and safety for all of the models from each automaker.
The top two brands this year are the same ones as 2023, with BMW leading the pack with an 82 point score, followed by Subaru—the leading mainstream brand—at 80. The key for both companies is their consistent combination of high road-test scores and very good predicted reliability. Porsche takes the third position with a score of 80. Both Porsche and Cadillac moved up 10 positions this year due to their improved reliability.
Keep in mind that even high-scoring brands can have some lower-performing models, so be sure to check the ratings (see page 36) for the autos you’re interested in. This is especially true for bigger brands like Ford and Toyota, which have some models that performed far better than others in our tests.
Of the 34 brands CR ranked this year, we’re recommending every model tested from seven: BMW, Porsche, Honda, Mini, Kia, Mazda, and Acura. Simply put: You can buy any tested model from those companies with confidence. (There are nine brands that don’t have a single model recommended by CR, including Dodge, Maserati, Alfa Romeo, Mercedes-Benz, Rivian, GMC, Jaguar, Land Rover, and Jeep. Consider carefully when buying one of those.)
To be included in the brand ranking, CR has to have tested at least two current models from a company. We’ve tested only one model from Lucid, Polestar, and Ram, so they aren’t included this year.
In the interactive chart below, you can see the full brand ranking, or you can see how the brands look when split into Mainstream and Luxury groups, which may better reflect how you shop. These distinctions are made at the brand level, of course, reflecting how the cars are positioned in the market, rather than the attributes of individual cars. The Overall Scores are calculated in the same manner and are comparable.
Change
Score
Reliability
Satisfaction
Tested
mmended
Choices
How We Rank the Car Brands
The Overall Score for individual models is based on four key factors: the road test, reliability, owner satisfaction, and safety.
For the road-test score, we put vehicles through more than 50 tests.
Predicted reliability ratings are based on problems reported by members from 20 possible trouble areas in CR’s Annual Auto Surveys.
Owner satisfaction predictions are based on whether CR members said in our surveys that they’d buy the same vehicle again if given the chance.
Safety includes an assessment of any available crash-test results and extra points assigned to vehicles that come standard with key crash-prevention systems.
Green Choices reflect how many of a brand’s CR-tested vehicles earned the designation for being in the top 20 percent of vehicles with the cleanest emissions, according to the EPA.
Learn more about how Consumer Reports tests cars.
Change
Score
Reliability
Satisfaction
Tested
mmended
Choices
Editor’s Note: This article also appeared in the April 2024 issue of Consumer Reports magazine.
